As part of the series, How I configured Jenkins CI server in a Docker container - I wanted to implement some sort of continuous code quality and integrate it to my continuous testing environment and on this post I will document how I configured SonarQube for continuous inspection of code quality (I have OCD when it comes to code quality) and we will perform a test on our local Git repository.
What is SonarQube?
SonarQube (formerly Sonar) is an open source platform developed by SonarSource for continuous inspection of code quality to perform automatic reviews with static analysis of code to detect bugs, code smells, and security vulnerabilities on 20+ programming languages. SonarQube offers reports on duplicated code, coding standards, unit tests, code coverage, code complexity, comments, bugs, and security vulnerabilities.
Prerequisites
Before we can continue, ensure that:
- Java 8 is installed
- Docker and Jenkins (>Version 2.9) are configured
Run SonarQube Server
SonarQube is available as a standalone server, configuring it is simple and straight forward. For this post I will be using the official SonarQube Docker image with default settings.
The server is started this way and by default you can login as admin with password admin which can be changed later on, for more detailed read Sonar Authentication doc
# This will download the latest sonarqube build and run it on localhost:9000
$ docker run -d --name sonarqube -p 9000:9000 -p 9092:9092
Confirm that the server is up,

Running and,
Once that is confirmed:
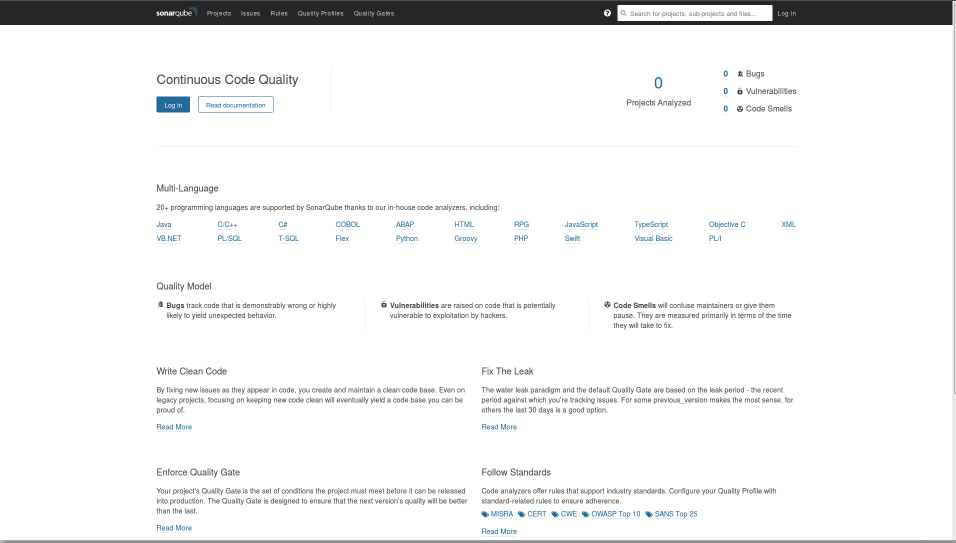
- Open your browser and head to http://localhost:9000 and you should see SonarQube’s homepage
- Login with admin/admin and follow the prompts.
- Follow all prompt and save your token for future use.
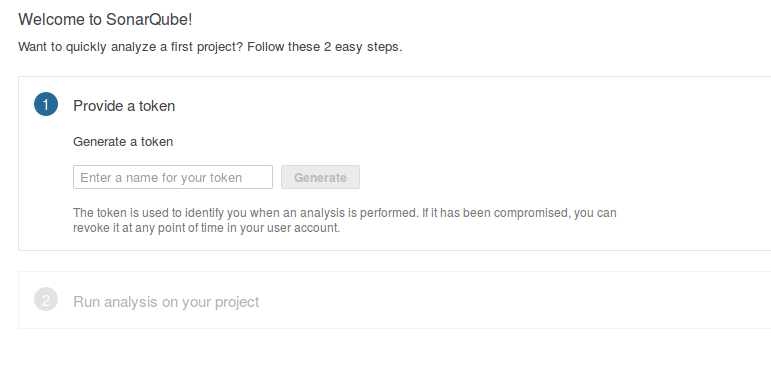
- Follow all prompt and save your token for future use.
- Go to the Administration tab -> Marketplace -> Installed
- Confirm that SonarPython plug-in is installed, if not install it.
- Restart the SonarQube server if needed.
Configuring SonarScanner on Jenkins
An alternative to this would be to run SonarScanner from your local machine but this post is about us running the scanner on Jenkins.
Installation
- We will need to install Sonar plug-in for Jenkins
- Open your Jenkins CI server on your browser and login as administrator.
- Go to: Manage Jenkins -> Manage Plugins -> Available
- Search and Install ‘Sonar’, if you cannot find it
- Download latest Sonar.hpi plugin
- Select Advanced -> Upload Plugin -> Restart Jenkins
- Configure your SonarQube Servers on Jenkins
- Go to Manage Jenkins -> Configure System
- Scroll down to the SonarQube servers section
- Enable: Enable injection of SonarQube server configuration as build environment variables
- click on Add SonarQube, and add the values you’re prompted for
- Name: SonarQube
- Server Authentication token obtained, elif you do not have the token read User Guide - User Token
Enable analysis with SonarQube Scanner
In order to trigger SonarQube analyses with the SonarQube Scanner, we will need to define our sonarqube scanner instance on Jenkins global configuration.
- Open your Jenkins CI server and login as administrator
- Go to: Manage Jenkins -> Global Tool Configuration
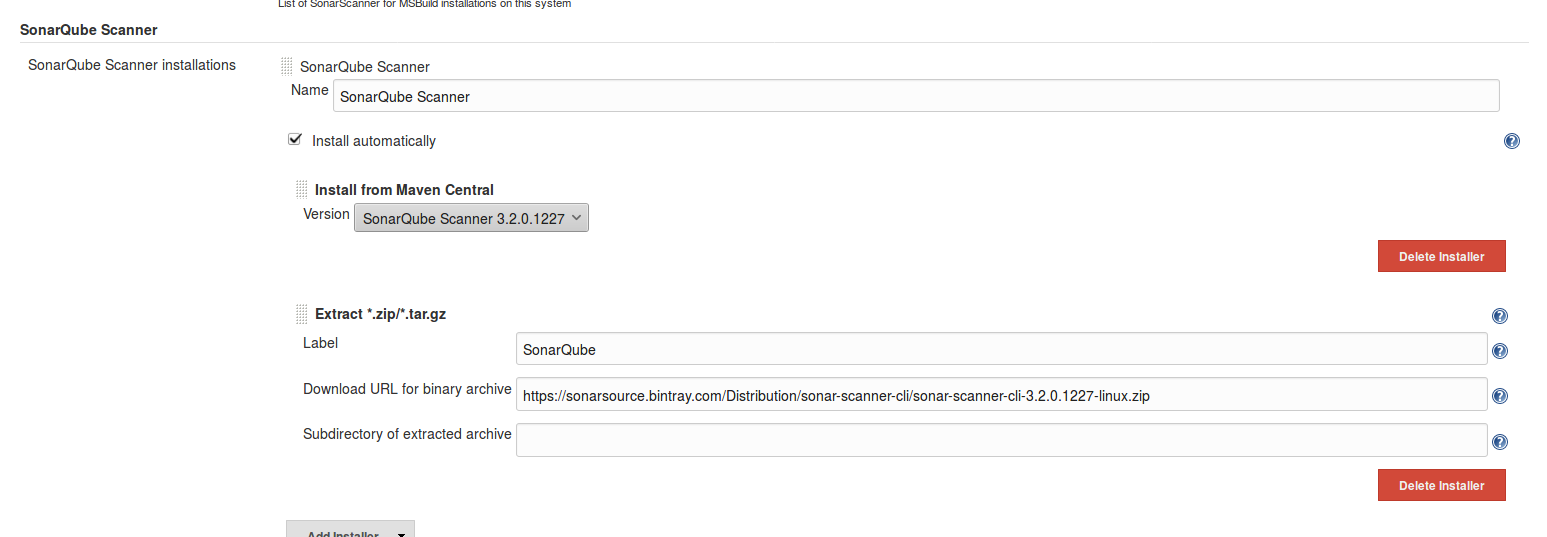
- Scroll down to the SonarQube Scanner configuration section
- Click on Add SonarQube Scanner and
- Enable: Install Automatically or choose to point to an already installed version of SonarQube Scanner (uncheck ‘Install automatically’) or tell Jenkins to grab the installer from a remote location (check ‘Install automatically’)
- Save and exit
Configure Jenkins build
- Once we have configured SonarQube, we can now run a SonarQube build
- Go to your Jenkins build,
- Configure -> Build Environment -> Enable: Prepare SonarQube Scanner environment
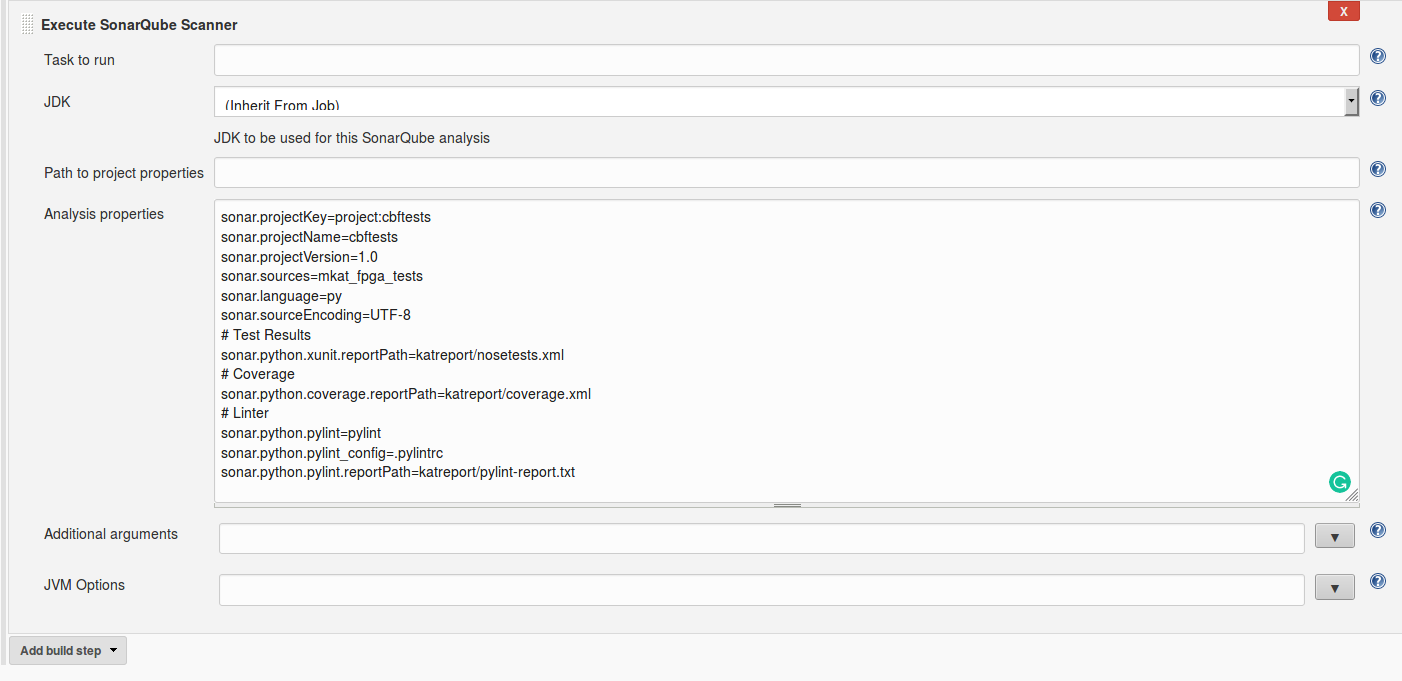
- -> Build -> Add build step -> Execute SonarQube Scanner
- Now we need to either point the executer to a path with project properties or add our own Analysis properties.
- Create sonarscanner properties
- Let JDK: inherit from Job
sonar.projectKey= sonar.projectName= sonar.projectVersion=1.0 sonar.sources= sonar.language=py sonar.sourceEncoding=UTF-8 # Test Results sonar.python.xunit.reportPath=nosetests.xml # Coverage sonar.python.coverage.reportPath=coverage.xml # Linter (https://docs.sonarqube.org/display/PLUG/Pylint+Report) #sonar.python.pylint=/usr/local/bin/pylint #sonar.python.pylint_config=.pylintrc #sonar.python.pylint.reportPath=pylint-report.txt- My personal properties
- Once the Sonar scanner is configured, we need few more tools. SonarQube scanner will not execute our tests or generate coverage information. We will need to user nosetests with xunit and coverage plug-ins for that. These tools can be installed simply by adding another build step:
-
Select Add build step -> Execute Shell and add following code
  #!/bin/bash
  set -e
  pip install nose coverage nosexcover pylint
-
-
Once installed, you need to execute nosetests to run your unit tests, and generate information relating to the source code. The following line runs the test runner, generates coverage information, and generates an XML test report that SonarScanner will use:
#!/bin/bash set -e nosetests -sv --with-xunit --xunit-file=nosetests.xml --with-xcoverage --xcoverage-file=coverage.xml -
Confirm that SonarQube is configured in your build.
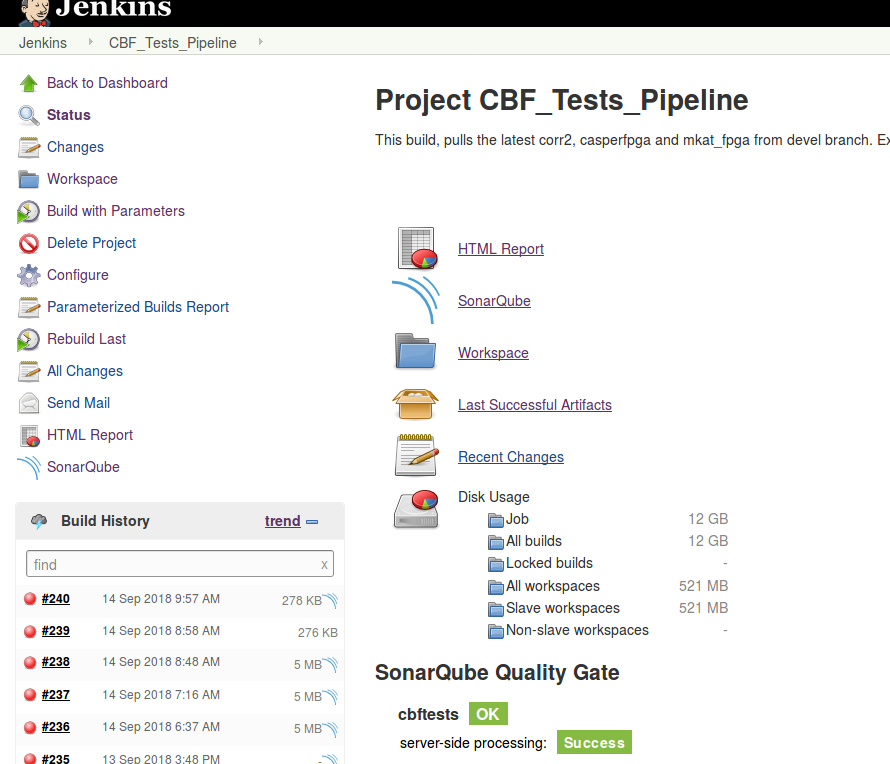
Save, execute your build and check the logs.
-
Below is a sample of my logs.
 # sample of my logs
 Using config file /home/cbf-test/jenkinsswarm/fsroot/sharedspace/CBF_Tests/.pylintrc
 [CBF_Tests] $ /home/cbf-test/jenkinsswarm/fsroot/tools/hudson.plugins.sonar.SonarRunnerInstallation/SonarQube_Scanner/bin/sonar-scanner -Dsonar.host.url=http://cmc3.cbf.mkat.karoo.kat.ac.za:9000 ******** -Dsonar.sourceEncoding=UTF-8 -Dsonar.sources=mkat_fpga_tests -Dsonar.language=py -Dsonar.python.pylint_config=.pylintrc -Dsonar.python.xunit.reportPath=katreport/nosetests.xml -Dsonar.python.coverage.reportPath=katreport/coverage.xml -Dsonar.projectVersion=1.0 -Dsonar.projectKey=project:cbftests -Dsonar.python.pylint=pylint -Dsonar.python.pylint.reportPath=katreport/pylint-report.txt -Dsonar.projectName=cbftests -Dsonar.projectBaseDir=/home/cbf-test/jenkinsswarm/fsroot/sharedspace/CBF_Tests
 INFO: Scanner configuration file: /home/cbf-test/jenkinsswarm/fsroot/tools/hudson.plugins.sonar.SonarRunnerInstallation/SonarQube_Scanner/conf/sonar-scanner.properties
 INFO: Project root configuration file: /home/cbf-test/jenkinsswarm/fsroot/sharedspace/CBF_Tests/sonar-project.properties
 INFO: SonarQube Scanner 3.2.0.1227
 INFO: Java 1.8.0_181 Oracle Corporation (64-bit)
 INFO: Linux 3.16.0-0.bpo.4-amd64 amd64
 INFO: User cache: /home/cbf-test/.sonar/cache
 INFO: SonarQube server 7.1.0
 INFO: Default locale: "en_ZA", source code encoding: "UTF-8"
 INFO: Publish mode
 INFO: Load global settings
 INFO: Load global settings (done) | time=76ms
 INFO: Server id: AWXSwbh2tGn7YMopyR4P
 INFO: User cache: /home/cbf-test/.sonar/cache
 INFO: Load plugins index
 INFO: Load plugins index (done) | time=64ms
 INFO: Load/download plugins
 INFO: Load/download plugins (done) | time=17ms
 INFO: Process project properties
 INFO: Load project repositories
 INFO: Load project repositories (done) | time=61ms
 INFO: Load quality profiles
 INFO: Load quality profiles (done) | time=20ms
 INFO: Load active rules
 INFO: Load active rules (done) | time=1319ms
 INFO: Load metrics repository
 INFO: Load metrics repository (done) | time=73ms
 INFO: Project key: project:cbftests
 INFO: Project base dir: /home/cbf-test/jenkinsswarm/fsroot/sharedspace/CBF_Tests
 INFO: -------------  Scan cbftests
 INFO: Load server rules
 INFO: Load server rules (done) | time=755ms
 INFO: Base dir: /home/cbf-test/jenkinsswarm/fsroot/sharedspace/CBF_Tests
 INFO: Working dir: /home/cbf-test/jenkinsswarm/fsroot/sharedspace/CBF_Tests/.scannerwork
 INFO: Source paths: mkat_fpga_tests
 INFO: Source encoding: UTF-8, default locale: en_ZA
 INFO: Language is forced to py
 INFO: Index files
 INFO: 8 files indexed
 INFO: Quality profile for py: Sonar way
 INFO: Sensor Python Squid Sensor [python]
 WARN: No report was found for sonar.python.coverage.reportPath using pattern katreport/coverage.xml
 INFO: Sensor Python Squid Sensor [python] (done) | time=2093ms
 INFO: Sensor PythonXUnitSensor [python]
 INFO: Processing report '/home/cbf-test/jenkinsswarm/fsroot/sharedspace/CBF_Tests/katreport/nosetests.xml'
 INFO: Sensor PythonXUnitSensor [python] (done) | time=171ms
 INFO: Sensor SonarJavaXmlFileSensor [java]
 INFO: Sensor SonarJavaXmlFileSensor [java] (done) | time=0ms
 INFO: Sensor Zero Coverage Sensor
 INFO: Sensor Zero Coverage Sensor (done) | time=49ms
 INFO: Sensor CPD Block Indexer
 INFO: Sensor CPD Block Indexer (done) | time=0ms
 INFO: Calculating CPD for 8 files
 INFO: CPD calculation finished
 INFO: Analysis report generated in 149ms, dir size=1 MB
 INFO: Analysis reports compressed in 134ms, zip size=279 KB
 INFO: Analysis report uploaded in 61ms
 INFO: ANALYSIS SUCCESSFUL, you can browse http://cmc3.cbf.mkat.karoo.kat.ac.za:9000/dashboard/index/project:cbftests
 INFO: Note that you will be able to access the updated dashboard once the server has processed the submitted analysis report
 INFO: More about the report processing at http://cmc3.cbf.mkat.karoo.kat.ac.za:9000/api/ce/task?id=AWXXjJ8rerXxRcU6yHMA
 INFO: Task total time: 6.356 s
 INFO: ------------------------------------------------------------------------
 INFO: EXECUTION SUCCESS
 INFO: ------------------------------------------------------------------------
 INFO: Total time: 7.620s
 INFO: Final Memory: 26M/2339M
 INFO: ------------------------------------------------------------------------
Interpreting SonarQube’s Results
Once we have confirmed that our SonarQube build was executed, we need to head to http://localhost:9000/dashboard/index/projectKey
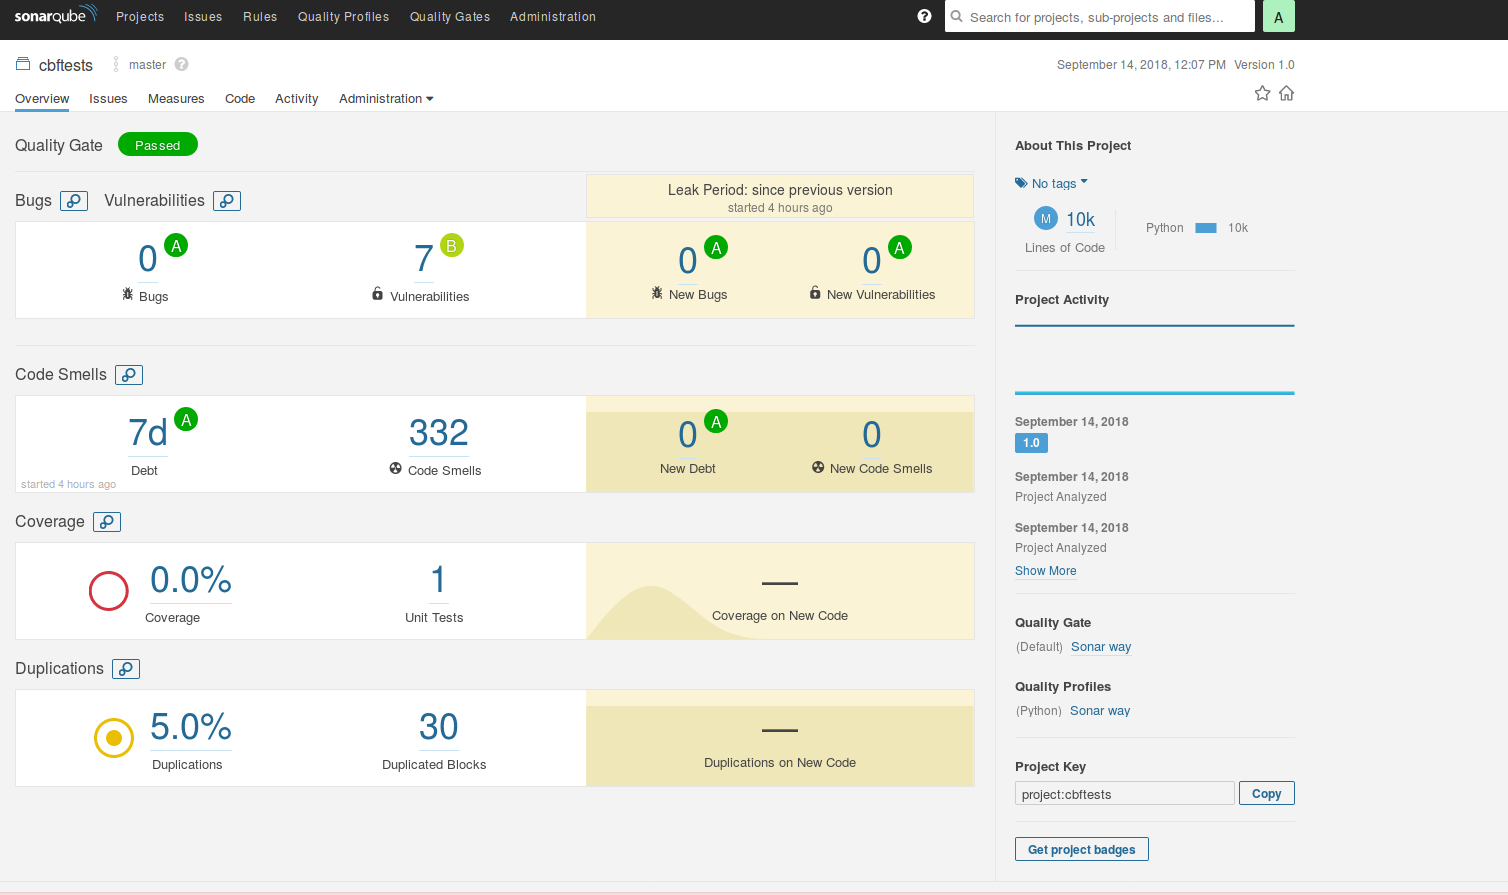
On the dashboard for the project, you can see metrics related to the unit test coverage(In this case it didn’t go through), the unit test success, code duplicates and etc.
Conclusion
SonarQube server and SonarQube Scanner provide a simple and effective way to inspect what your unit tests are actually testing with only a few extra packages. This only scratches the surface of what SonarQube can actually do. In a future post, I will examine some of the other SonarQube metrics, and how they can help improve code quality. Read more about SonarQube
Reference
- https://en.wikipedia.org/wiki/SonarQube
- https://docs.sonarqube.org/display/SONAR/Documentation/
- https://www.sonarqube.org/
- https://hub.docker.com/_/sonarqube/
- https://docs.sonarqube.org/display/SONAR/Authentication
- https://www.sonarsource.com/products/codeanalyzers/sonarpython.html
- https://docs.sonarqube.org/display/SCAN/Analyzing+with+SonarQube+Scanner
- https://updates.jenkins-ci.org/download/plugins/
- https://docs.sonarqube.org/display/SCAN/Analyzing+with+SonarQube+Scanner+for+Jenkins
- https://docs.sonarqube.org/display/SONAR/User+Token
- https://nose.readthedocs.io/en/latest/man.html
- https://coverage.readthedocs.io/en/coverage-4.5.1a/