Disclaimer: AI-assisted editing and structure. The incident, technical decisions, analysis, and opinions are mine.
One ::varchar cast. That’s it. That’s the whole blast radius of what you’re about to read.
I needed one of our AI agent’s tool to return a record plus its latest history entry and its latest processing status in one round trip instead of three. I wrote a CTE, joined three tables, cast a mismatched column so the join key would line up, and moved on. Tests passed. QA passed. Correct rows, correct order, every time I ran it.
Then it shipped, and a table with over 9 million rows stopped being partitioned in any way that mattered. Every call from the agent’s tool turned into a full scan across every partition instead of the one holding that customer’s rows. Average latency on that endpoint climbed to around 3 seconds. The app team felt it first, not me. Their principal engineer saw degradation and a dashboard lighting up, chased it down to a service account hammering the database, and only then traced that account back to my query. By the time anyone knew it was me, they’d already done most of the diagnosis.
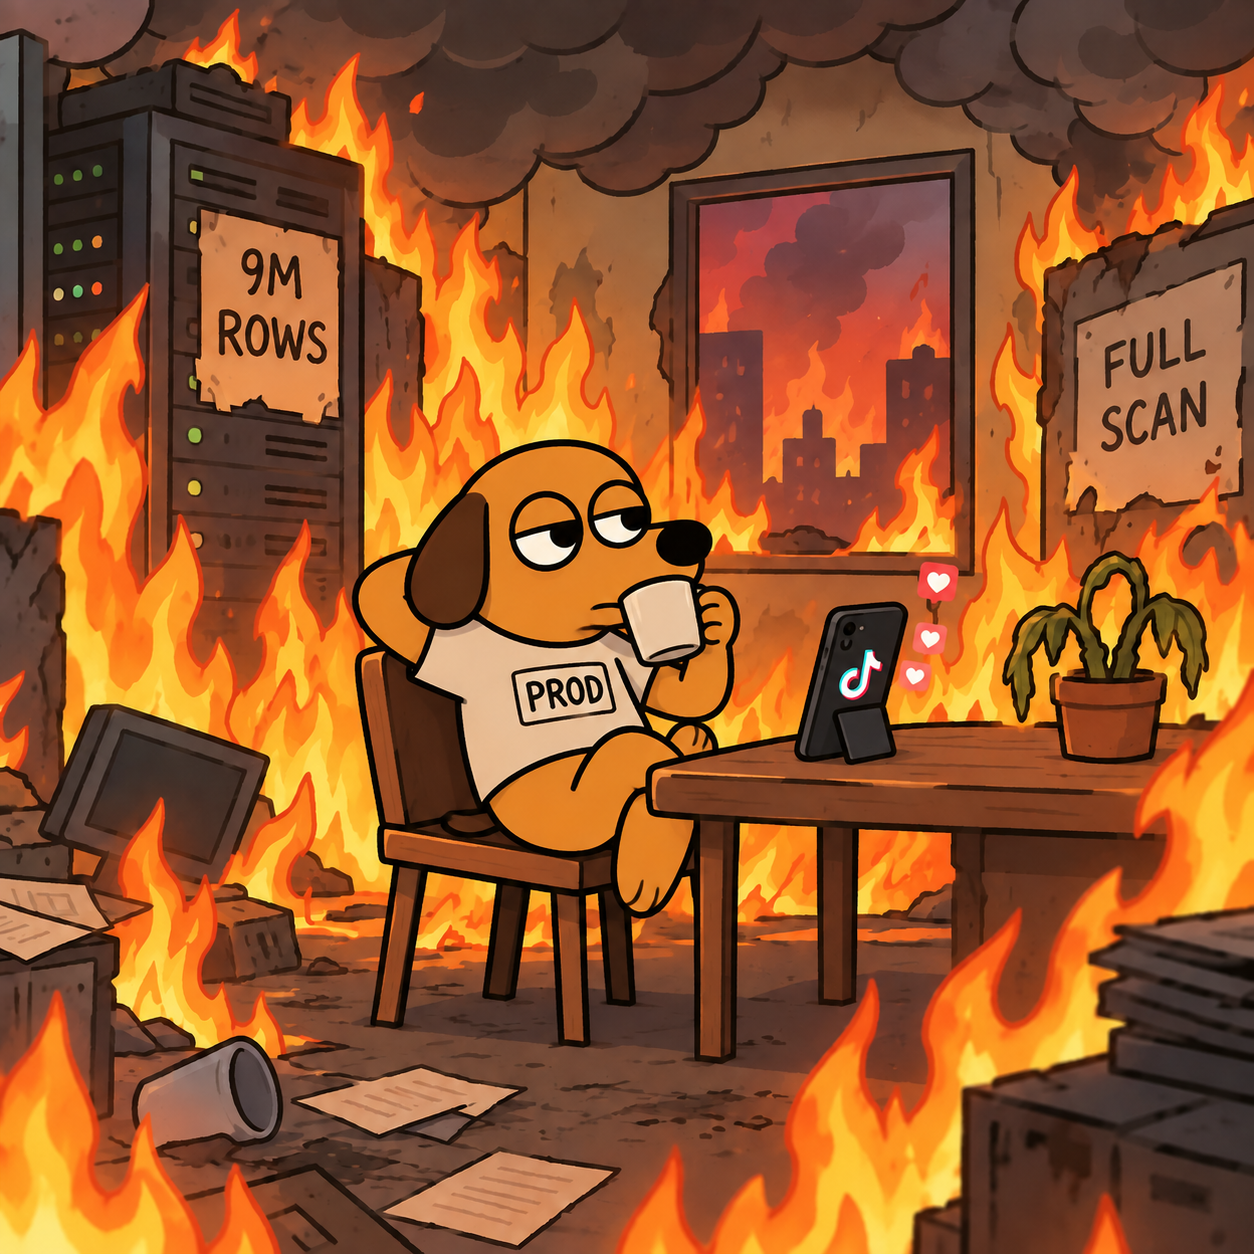
The table I’d joined against also turned out to have no index on the column I was joining on, same as its neighbours, because it was newly commissioned and not yet fully wired into the indexing story everyone else had already been through. I’d picked it because it had exactly the extra field I wanted. That’s the part that still stings a little.
The SQL mistake is the easy part of this story to recognise. The harder part is why it became an incident so quickly: this was not an ordinary endpoint with a predictable caller. It was a database query behind an agent tool. The model could invoke it zero times, once, or repeatedly depending on the conversation, orchestration, retries, delegation, and model behaviour. A query that might have been merely “a bit expensive” under deterministic application traffic had become a resource multiplier at an autonomous boundary.
TL;DR
- A join inside an AI agent’s tool call cast a column to match a type mismatch, correctly, but that column belonged to a table with over 9 million rows partitioned by customer identifier.
- The cast defeated partition pruning. A per-customer lookup turned into a scan across every partition. Average latency on the endpoint climbed to around 3 seconds.
- The table I joined against had no index on the join column at all, same gap as its sibling tables, because it was recently added and hadn’t been fully commissioned into the rest of the schema’s indexing story yet. I picked it anyway because it had a field I wanted.
- No load or performance test existed before the incident. QA validated correctness only. Nobody exercised this query at production data volume before it shipped.
- The fix removed the join entirely: three independent, parameterised queries run concurrently and merged in application code.
- The important change was not only the SQL. It was recognising that an agent tool has no naturally bounded invocation pattern, so its database work needs an operational bar designed for variable, bursty, model-driven traffic.
- The team built a background guardrail afterward that checks registered queries against a live execution plan, but it only ever asks the database for a plan. It never executes the query. That distinction matters, and it’s easy to get backwards.
- Downstream systems noticed the problem from their own dashboards before the team that shipped the query did. That’s the real lesson.
The Story
The setup: an AI agent built on Google ADK had a tool whose only job was to look up a customer’s saved records. An orchestrator agent decided when to hand the turn off to this agent, and this agent decided when to call the tool as part of answering whatever the customer had asked. Nothing about that call pattern was scheduled or predictable. It could fire zero times, once, or repeatedly on conversational time, not clock time. No cron, no fixed batch, and no ceiling anyone had designed on purpose.
That call chain is the whole reason this bug behaved the way it did. It sits at the bottom of a stack that looks roughly like this:
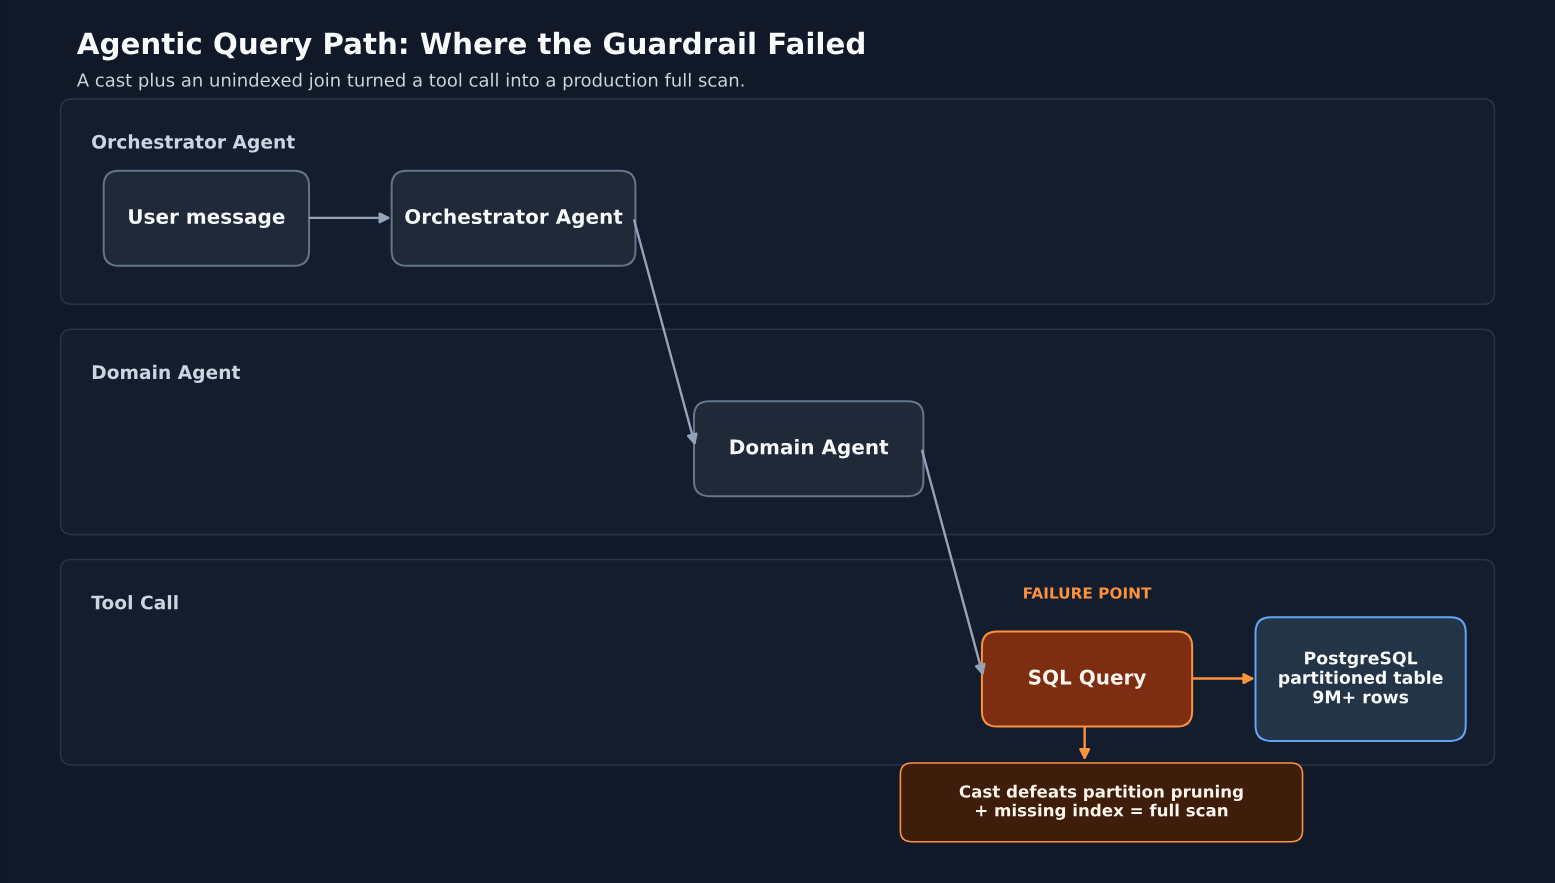
Every layer above the SQL query is a decision an LLM made about whether, when, and how often to call the tool. Every layer below it is a database doing exactly what the query asked. The failure lived at the bottom, but the traffic pattern hitting it was set by whatever the top of that stack decided a customer’s question was worth. That is the operational difference: an ordinary backend tool often inherits a traffic pattern its team can describe; an agent tool inherits a decision process.
The tool’s underlying query needed three pieces of information:
- The record itself,
- The most recent history entry for that record, and
- The most recent processing status.
Three separate tables. My data engineering instinct was like, “Dude, just create a CTE bro and join everything in one go – it’ll be way cleaner and probably faster too.”
What came next was a CTE (Common Table Expression) selecting the customer’s records, then two LEFT JOINs pulling in the latest history and the latest status, each narrowed with DISTINCT ON to just the newest row per record. Simple, elegant, and exactly what my data engineering instinct had suggested.
However, unbeknownst to me at the time, this elegant query was about to run into a performance nightmare.
One of the join keys was a numeric ID/bigint on one side and a text ID on the other, a mismatch that happens constantly when two tables get designed months apart by two different owners – I suspect.
I mean in my previous life I worked with analytical databases so casting the numeric ID to text felt completely natural to me. I mean the production postgres database didn’t complain either, so I figured I was in the clear and I was like oh well, what’s the worst that could happen?
The table on the other side of that join, the one holding the latest processing status, was a genuinely new addition to the schema it seems. It had exactly the field I needed and nothing else did which would improve my LLM tool’s ability to answer the customer’s question accurately.
So this was an obvious choice, and so I reached for it. What I didn’t check first: The table I am joining against had no index on the column I was about to join against, same gap its older sibling tables had already had fixed months earlier. It just hadn’t been fully commissioned into that cleanup pass yet.
A quick check would have shown it, but what did I do – Assume (we all know Assume means “ass of u and me” right?)
SELECT indexname, indexdef
FROM pg_indexes
WHERE schemaname = 'records' AND tablename = 'record_events';
-- zero rows for anything touching the join column
I didn’t run that query before shipping. I ran it during the postmortem – I mean we all learn eventually, right?
Here’s a shape of what that CTE looked like, with the real table and column names replaced obviously – I still want to keep my job:
WITH customer_records AS (
    SELECT *
    FROM records.records
    WHERE customer_id = %s
),
latest_history AS (
    SELECT DISTINCT ON (h.record_id)
        h.record_id, h.detail
    FROM records.record_history AS h
    JOIN customer_records AS r ON r.id = h.record_id
    ORDER BY h.record_id, h.event_date DESC NULLS LAST
),
latest_status AS (
    SELECT DISTINCT ON (e.record_id)
        e.record_id, e.status
    FROM records.record_events AS e
    JOIN customer_records AS r ON r.id::varchar = e.record_id -- This was the smoking gun
    ORDER BY e.record_id, e.modified_date DESC NULLS LAST
)
SELECT r.*, h.detail, s.status
FROM customer_records AS r
LEFT JOIN latest_history AS h ON h.record_id = r.id
LEFT JOIN latest_status AS s ON s.record_id = r.id
ORDER BY r.id;
Every part of that query is defensible on its own. The CTEs are readable. The DISTINCT ON pattern is a normal way to get the latest row per group in PostgreSQL. The cast is a fix for a type mismatch that a code reviewer would nod at and move on from. Individually, none of it looks like the kind of thing that takes down a client-facing app.
And that, my friends, is how a single query inside an AI agent took down a client-facing app.
Why QA Never Caught It
Database owners first question, did you test your query against QA? Why does it seem like you were running debug queries directly against production? But yes, I had tested it against QA. It returned the right data. Every field was correct, every join matched the right rows, every edge case I’d thought to test (missing history, missing status, empty result set) came back clean.
Nobody ran this query against anything resembling production data volume before it shipped. There was no load test in the pipeline at the time, for this query or its neighbours. (There is now. That part of the story comes later.) QA’s dataset was small enough that any reasonable execution plan finishes fast regardless of whether the database chooses an efficient one. Correctness and performance are different questions, and QA was only ever answering the first one.
The Cast I Never Thought Twice About
Here’s the part that took me longest to understand properly, and the part I got wrong in my own head for a while: I assumed the danger of a cast on a join key was that it stops the database from using an index on that column. That’s true, and it’s the story most people tell about this class of bug. It is not the whole story here.
customer_records was pulling directly from a table partitioned by customer identifier. The cast I added was on a column belonging to that partitioned table, not on the partition key itself, just a regular column on the same table. Casting any column on a partitioned table’s own row can be enough to stop PostgreSQL’s planner from pruning partitions for that query. Instead of narrowing down to the one partition holding this customer’s rows, the plan widens out to scan across all of them – a full partition scan instead of a targeted one.
That’s a different, larger failure mode than “missing index.” A missing index makes one table slow to scan. Losing partition pruning makes the database treat a partitioned table as if it weren’t partitioned at all, for every query shaped like this one.
And I’d stacked both. The partitioned table lost pruning because of the cast. The table I joined it against, the new one with the field I wanted, had no index on the join column to fall back on either. Two independent gaps, on two different tables, in the same query. Either one alone would have been a slow query. Both together, against a table north of 9 million rows, were a full scan on one side feeding a full scan on the other. Average latency on the endpoint sat around 3 seconds under load, up from what should have been a single-digit-millisecond lookup.
Ok, Ok I probably lost some of you with that explanation. Let me simplify it for the people at the back!
Hendrik you can skip this part
Picture a table with over 9 million rows chopped up into, say, a hundred smaller filing cabinets, one cabinet per customer group. That chopping up is the “partitioning.” When you ask for one customer’s records, PostgreSQL is supposed to be smart enough to open exactly one cabinet and ignore the other ninety-nine. That’s “partition pruning,” and it’s the entire reason partitioning is worth doing in the first place.
The cast broke that. The moment I wrote r.id::varchar, I changed the shape of the comparison just enough that the planner couldn’t prove which single cabinet held the answer anymore. So it played it safe and opened all hundred. Every query, every customer, every time.
Now stack the second table on top. That one wasn’t chopped into cabinets at all, it was one giant pile of paper with no index card telling you where anything was. So for every row that came out of the “open all hundred cabinets” step, PostgreSQL then had to flip through the entire pile by hand to find the matching status.
All hundred cabinets, times one giant unsorted pile, on every single tool call. That’s the whole bug. One character (::varchar) plus one missing index, multiplied by 9 million rows, however many times an hour an AI agent decided to ask.
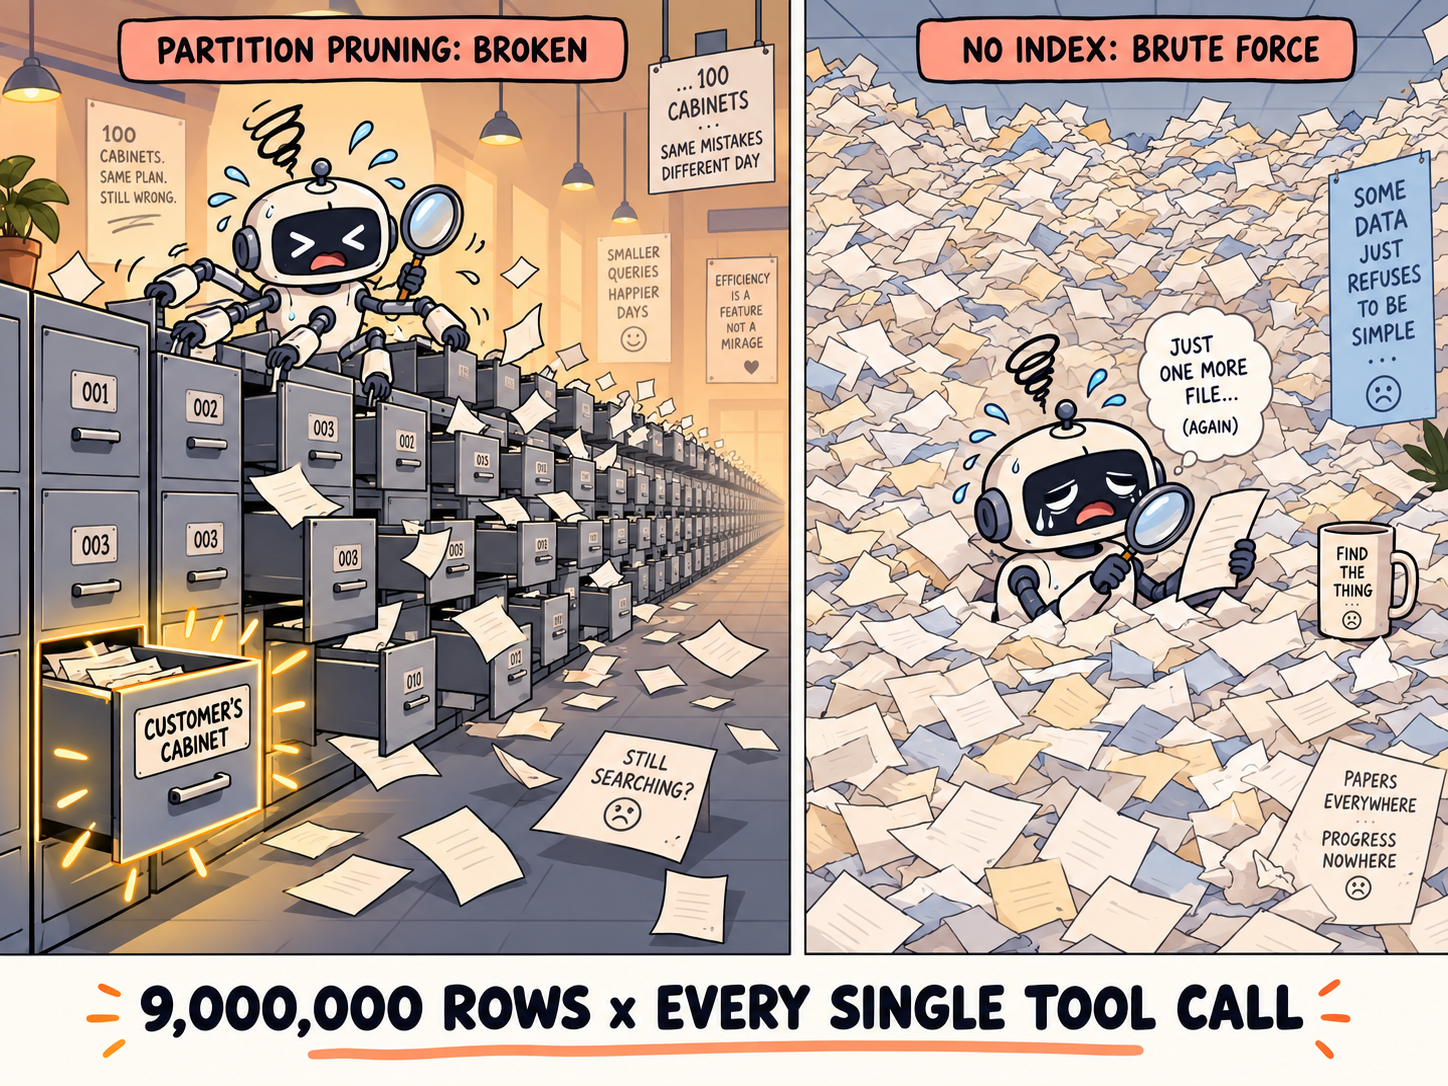
(I want to be honest about the limits of what I can show here: there’s no saved execution plan from the incident itself. What follows is the mechanism that the fix and my own notes from that week point to, not something I can paste a EXPLAIN screenshot to prove.)
Correct Results Are Not Operational Evidence
The lesson I kept circling back to while writing this: a query returning the right rows tells you almost nothing about whether it is safe to run in production. Correctness is about the WHERE and the JOIN conditions matching the data model. Cost is about cardinality, index usage, and, in this case, whether the planner can still prune partitions once you’ve touched a column it didn’t expect you to touch. Nothing about a passing test suite exercises that second dimension.
The Fix
What Actually Changed
The fix wasn’t a smarter cast or a new index. It was fewer assumptions about what’s safe to join in the first place.
The single coupled query became three independent ones. The record lookup went back to a plain, unjoined SELECT against the partitioned table, filtered only by customer identifier, no CTE, no cast. The history and status lookups became their own parameterised queries, each filtered by the list of record IDs already fetched, run concurrently, and merged by ID in application code instead of in SQL.
The results then get processed in Python on the application side, merging the independent query results by record ID instead of relying on SQL joins.
-- Record lookup: no joins, direct filter on the partition key
SELECT * FROM records.records WHERE customer_id = %s;

-- History lookup: independent, filtered by the IDs already fetched
SELECT DISTINCT ON (record_id) record_id, detail
FROM records.record_history
WHERE record_id = ANY(%s)
ORDER BY record_id, event_date DESC NULLS LAST;

-- Status lookup: same pattern, run concurrently with the query above
SELECT DISTINCT ON (record_id) record_id, status
FROM records.record_events
WHERE record_id = ANY(%s)
ORDER BY record_id, modified_date DESC NULLS LAST;
Running the history and status lookups concurrently instead of sequentially kept the total latency close to what the single joined query used to cost, without asking the database to reason about all three tables in one plan. The merge, matching history and status rows back onto each record by ID, moved into application code, which is a trade I’ll name honestly in a minute, because it isn’t free.
Here’s roughly what that merge looks like once all three queries come back:
record_ids = [row["id"] for row in records]

history_rows, status_rows = await asyncio.gather(
    fetch_latest_history(record_ids),
    fetch_latest_status(record_ids),
)

history_by_id = {row["record_id"]: row for row in history_rows}
status_by_id = {row["record_id"]: row for row in status_rows}

for record in records:
    history = history_by_id.get(record["id"])
    record["detail"] = history["detail"] if history else None

    status = status_by_id.get(record["id"])
    record["status"] = status["status"] if status else None
Two dictionary lookups per record, built once from the two independent result sets. No JOIN, no shared execution plan across three tables, just a plain dict keyed by ID. asyncio.gather is doing the same job the database used to do when it ran both lookups inside one plan, it’s just doing it at the application layer instead, where I can see and control it.
A load test for this exact access pattern went in alongside the fix. It hadn’t existed before. Roughly what it does: sample real record IDs from the database at runtime, fire several hundred concurrent lookups ramped over a fixed window instead of one instant burst, and report a latency distribution plus a failure breakdown, including anything that fails because the connection pool ran out before the query even got a chance to run slow.
async def one_call(repo, record_id, idx):
    t0 = time.perf_counter()
    try:
        rows = await repo.query_by_customer(record_id)
        return {"idx": idx, "ok": True, "elapsed": time.perf_counter() - t0, "count": len(rows)}
    except Exception as exc:
        return {"idx": idx, "ok": False, "elapsed": time.perf_counter() - t0, "error": str(exc)}


async def main(count=500, ramp_seconds=20.0):
    ids = await sample_record_ids(count)
    interval = ramp_seconds / count

    tasks = []
    start = time.perf_counter()
    for i in range(count):
        tasks.append(asyncio.create_task(one_call(repo, ids[i], i)))
        await asyncio.sleep(interval)

    results = await asyncio.gather(*tasks)
    print_latency_report(results, time.perf_counter() - start)
Run it against a non-prod database:
uv run python tests/load/records_stress_test.py --count 500 --ramp-seconds 20
What comes out the other end is a plain latency report:
Total requests:      500
Wall clock:          21.34s
Succeeded:           487 (97.4%)
Failed:              13 (2.6%)

Latency (successful calls, seconds):
  min:  0.008
  p50:  0.041
  p95:  0.312
  max:  1.187
  mean: 0.079

Failure breakdown:
  PoolTimeoutError: 13
That’s the boring, correct outcome. p50 stays low, p95 climbs a bit under concurrent load, and the handful of failures are honest pool-exhaustion timeouts, not the database choking on a bad plan. The point of running this isn’t to prove the query is fast, it’s to prove the query still behaves once several hundred calls land on it at once, which is the exact thing an AI agent can do without anyone scheduling it. That number, p95: 0.312, is what should have existed before the original query ever shipped. It didn’t.
Building a Guardrail, Honestly
Once the immediate fire was out, I messaged the team the postmortem, and how we resolved it including following steps which led to the team building something longer-lived:
- A background process that registers the read queries repositories run, checks each one against a stored snapshot of the schema, and, when both of those pass, asks the live database for an execution plan and inspects it for warning signs. Sequential scans on large tables. Cross-type casts that aren’t the free string-to-string kind. Nested loops with a large, unindexed side. A single plan node eating most of the total estimated cost.
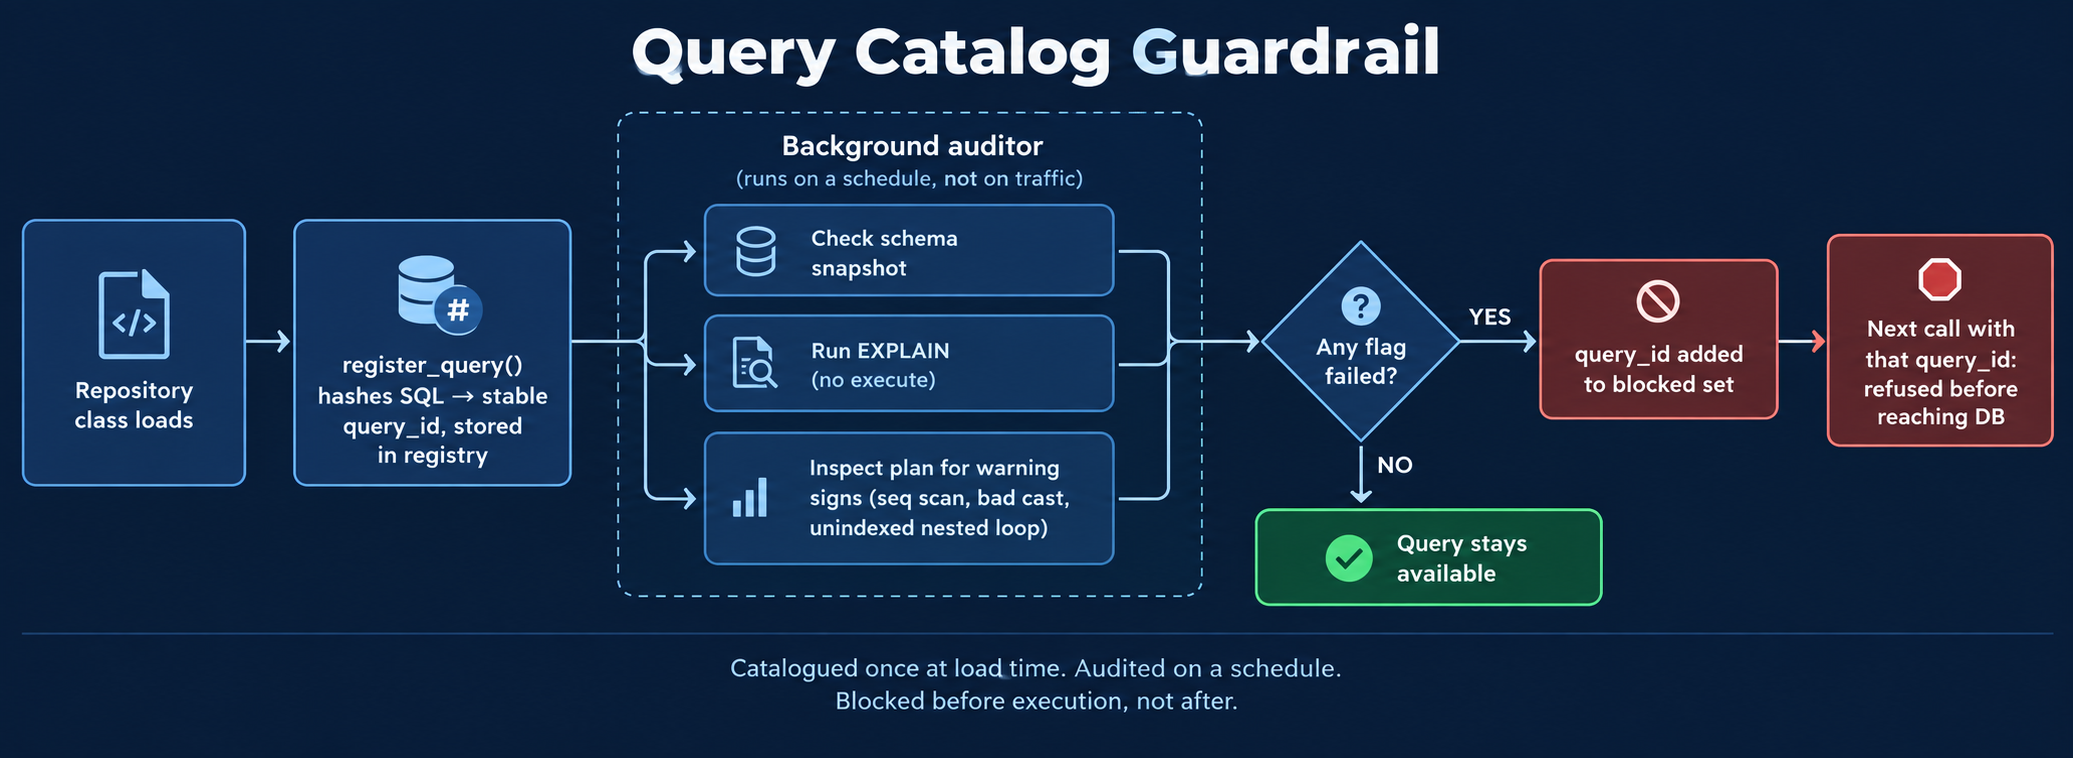
Every repository already registers its SQL up front, at class-definition time, instead of building query strings inline wherever they’re called:
_RECORD_QUERY = """
SELECT id, name, status, created_at
FROM records.record
WHERE customer_id = %s
ORDER BY id
"""

RECORD_QUERY_ID = RecordRepository.register_query(
    sql=_RECORD_QUERY,
    name="Get Records By Customer",
)
register_query hashes the SQL text into a short stable ID and stores {name, sql} in a per-class registry. Nothing runs yet, this only happens once, when the module loads. The point of doing it this way is that every registered statement becomes something a background process can iterate and check on its own schedule, without needing the application to run first: pull every {query_id: sql} pair out of the registry, run each one through EXPLAIN against a schema snapshot, and flag anything with a sequential scan on a large table, a cross-type cast, or a plan node with a wildly inflated cost estimate. Flagged query IDs get added to a blocked set, and the next time that query is called by ID, the repository refuses before it ever reaches the database:
if query_id in blocked_query_ids:
    logger.warning(f"Query '{name}' is blocked — audit flags failed.")
    await send_ms_teams_alert(f"[Query Audit] Query '{name}' for '{db_host}' is blocked — audit flags failed.")
    skip_execution = True
That’s the guardrail in outline: catalogue what runs, check it on a schedule that doesn’t depend on traffic, and log & notify the team with the ones that fail. It would have caught the cast in this incident, a cross-type cast on the partitioned table’s own column is exactly the kind of thing the plan inspection looks for. It didn’t exist yet when this query shipped, and even now it stops at the alert. Nothing gets blocked automatically, someone still has to see it and act.
The Part I Didn’t Catch First
The detection story is the part I keep coming back to. It wasn’t an alert I’d set up, or a dashboard I was watching. The app team, downstream of the tables my query touched, saw a repeating spike on their own monitoring, timed almost exactly to every run of the agent’s tool. Their principal engineer chased it, first as generic degradation, then down to the service account behind the load, and only at the end of that chase did it resolve to my query. I found out I was the cause after they’d already done the hard part.
That’s an uncomfortable thing to write plainly, so I will: the people who felt the impact first weren’t the people who wrote the query. They found it because they were watching their own systems closely, not because anything I’d built told them where to look. The conversation that followed was generous, given the circumstances, and it turned into a real question worth sitting with: how do you give the teams downstream of a query enough visibility into what that query is actually doing to their databases, before they have to find out from a dashboard spike and chase it back through a service account?
Hard-Earned Lessons
The SQL lessons are real, but they are not the whole takeaway. The larger lesson is that exposing ordinary backend work through an agent changes the assumptions around cost, frequency, and ownership.
1. An Agent Tool Is Not an Ordinary Endpoint
A test suite checks whether a query returns the right rows. It says nothing about whether the database had to scan everything to get them. I treated “the tests pass” as evidence the query was fine. It was only evidence the query was correct.
Since this incident, EXPLAIN on any new or changed query is not optional for me anymore, it’s a step I run through a small wrapper script before a query goes anywhere near a pull request, same as I’d run the tests. Something like:
bash scripts/dbquery.sh --host RECORDS_DB_HOST --output aligned --explain --query "SELECT r.id FROM records.records r JOIN records.record_events e ON r.id::varchar = e.record_id WHERE r.customer_id = 12345;"
For the query in this incident, that comes back with something like:
Gather  (cost=1000.00..8452301.55 rows=1 width=8)
  Workers Planned: 2
  ->  Parallel Seq Scan on record_events e  (cost=0.00..8451301.45 rows=1 width=16)
        Filter: ((r.id)::text = record_id)
  ->  Index Scan using records_pkey on records r  (cost=0.29..8.31 rows=1 width=8)
        Index Cond: (id = 12345)
The important signals in a plan like that are the Parallel Seq Scan, the large table on the unindexed side, and the cast sitting in the comparison. They are not subtle once you ask for them. The hard part is remembering to ask before the query ships.
The lesson: passing tests prove correctness, not cost. Ask for the execution plan separately, every time.
2. Identify the Partitioned Side Before You Cast Anything
I knew the general folklore that casting a join key can hurt index use. I didn’t know, at the time, that casting any column on a partitioned table’s own row, not just the partition key, can be enough to lose partition pruning for that query. The large or partitioned table in a join deserves extra scrutiny for every column you touch on it, not just the ones in the WHERE clause.
The lesson: before writing a cast in a join condition, know which side is partitioned, and don’t touch its columns if you can cast the other side instead.
3. QA Environments Rarely Argue With the Planner
My QA dataset was too small to expose a bad plan. Any reasonable execution strategy finishes fast against a few thousand rows. The planner only had a reason to make a different, worse choice once it was looking at production-scale cardinality, which QA never showed it.
The lesson: a query that only ever runs against small data hasn’t been tested for the thing that actually breaks in production, which is scale, not correctness.
4. Someone Downstream Will Notice Before You Do
The team that found this wasn’t watching my code. They were watching their own dashboards, and the pattern was obvious enough from their side that they traced it back to my query faster than I noticed anything myself. That’s not a story about their vigilance, it’s a story about my blind spot.
The lesson: if an agent tool can create load that your own team cannot attribute, you do not have observability into the tool. You have someone else’s dashboard and goodwill.
Trade-offs Worth Naming
- Merging in application code instead of SQL moves work, not away. Three round trips and an in-memory join by ID is easier for the database to reason about, but it’s more code, more places for an off-by-one ID mismatch to hide, and it makes the database do less thinking at the cost of the application doing more.
- Running queries concurrently instead of sequentially trades total latency for connection pressure. The fix kept latency close to the original by running two lookups at once, which means every request now briefly holds more than one connection out of a pool that isn’t infinite.
- Splitting one query into three shifts complexity toward the caller, not away from the system. The database plan got simpler. The number of things that have to go right at the call site (three queries, a concurrent gather, a correct merge) went up.
- Agent tooling makes ownership cross-layer. The model decides whether to call the tool, the application decides how to execute it, and the database absorbs the cost. A guardrail that watches only one layer will miss the interaction between them.
Conclusion
The query that took the app down wasn’t wrong. It returned the right data, in the right shape, every time anyone tested it. What it lacked was evidence that it would behave the same way when placed behind an agent tool: a boundary where the caller could invoke it zero times, once, or repeatedly based on a conversation and a chain of model decisions.
I still think about the fact that a different team found this before I did, from their own dashboard, not from anything I’d built to tell them. Building a guardrail that checks plans is a reasonable response to that. It is not the same as giving the teams downstream of your queries the visibility they’d need to not have to find out the hard way again.
Going forward, the bar for me is simple: no query ships without its plan checked, and no access pattern an agent can call unpredictably ships without a load test that exercises its real invocation shape, not just one successful request. Agent tools need explicit limits, query identity that survives the whole call chain, and dashboards that let downstream teams see which tool is creating the load. The SQL guardrail catches one class of mistake. The operational model has to account for the caller above it.